It's Always Been About Free Cash Flow
How many years will it take a company to generate its market cap in free cash flow?
Cash flows are what determines share price in the long run. This has always been the case, we are just being reminded of it violently right now.
Businesses must make money. And the money they generate, minus expenses, between now and the end of time, discounted appropriately to the present, should be approximately what you are willing to pay for a business.
That reality is easy to forget. Even if you believe it and it’s top of mind, there are distortions that make you question it. Price often precedes narrative. If a stock is on a seemingly unstoppable run, investors get increasingly optimistic and raise their expectations. They think “ya know what, maybe they will crush earnings. I’ll just go to my model, raise revenue numbers, ramp margins quicker, and I can see a 3% terminal growth rate, why not? Oh, would you look at that, this thing’s actually cheap!”
Compounding this problem is that fact that owning shares is abstract. You know in theory that they represent a residual claim on a business’s assets and earnings, but in reality, you are one of millions of “owners” and your asset is really a ticker on the screen that is instantly swappable for cash.
When value investors say to “think like an owner,” they mean imagine that you own the entire business and you couldn’t sell it with the click of a button. If you were the sole proprietor of a deli, you wouldn’t pray for a temporary sandwich tailwind and try to sell the shop to another person who thought it was worth more - you would attempt to pay back your original investment with the cash flows from the business.
It’s such a fundamental reality that it feels silly to discuss.
Our investment philosophy and process at Loup is heavily geared toward valuing businesses based on the cash they will produce and ignoring most noisy methods like using multiples or comps. We want to hold shares for long periods of time in order to reap the benefits of business compounding. But even then, even if we are right, and an investment goes on to produce enough cash to pay back more than our initial per share purchase price, we will ultimately be compensated not by cash payments but by selling our shares to someone who thinks it will go even higher.
So if even those who preach the virtues of compounding are ultimately getting “paid back” by selling their over-priced (or fairly-priced) shares to the next guy, do cash flows even drive performance?
Let’s go to the numbers.
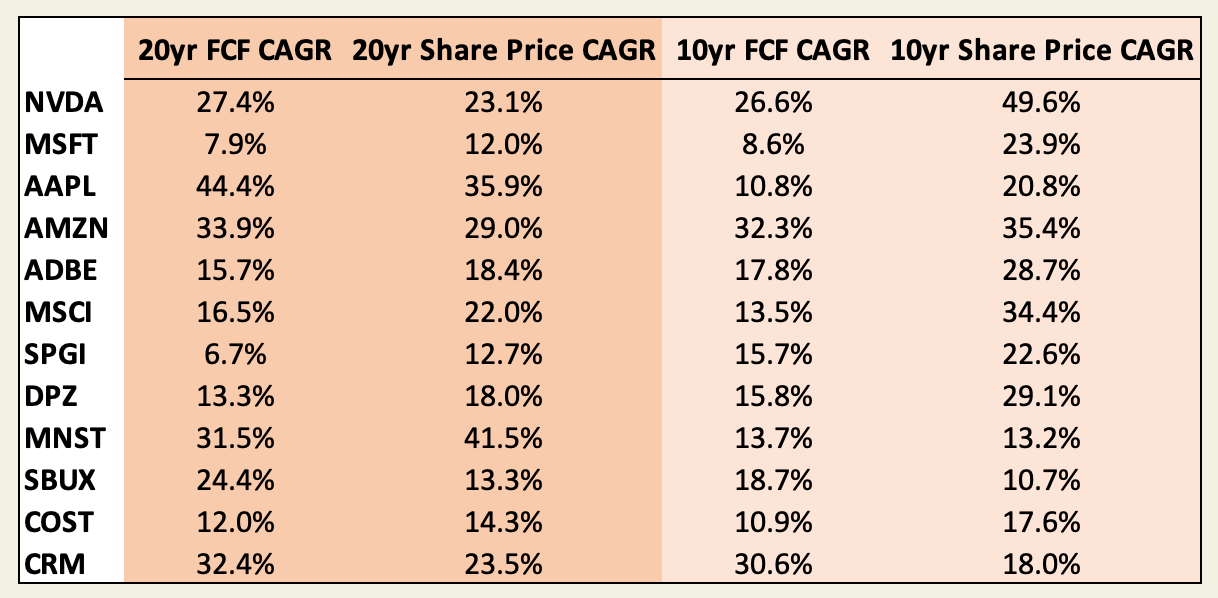
This table shows the compound annual growth rate of free cash flow and share price over 20- and 10-year periods starting in 2001. (note: not all companies above have 20-year historicals). To me, this simple dataset shows that, over the long run, share price performance roughly matches business compounding, as measured by free cash flow, the most important metric as it relates to determining value. Here is the data in a more visual format:
I am aware that this group of a dozen companies could represent a cherry-picked group of survivors, but I think it serves as an explicit reminder of an important truth that is easy to lose sight of - if a company grows its free cash flow significantly, the stock will go up… often times more significantly than the FCF growth.
In nine of twelve of the cases above, share price CAGR was higher than the FCF CAGR over the 10-year period. Over the 20 years, this was the case for seven of the twelve. The average delta between share price and FCF growth over 20 years was also narrower than over 10 years, suggesting that the longer the period, the closer those two metrics should mirror each other.
Free Cash Flow Payback Period
In the spirit of keeping cash flow at the forefront, we have been assessing potential investments through the lens of the free cash flow payback period. How many years will it take a company to generate its current market cap in free cash flow? If you can get comfortable with a reasonable answer to that question, it will remove a lot of valuation noise and allow you to sleep well knowing that the mechanics of how your investment becomes a good one are nearly bulletproof.
Of course, these numbers are unknowable before hand. It requires making assumptions about revenue growth and free cash flow margins. Let’s start with a less favorable example.
Snowflake, as of writing, trades at $127 or about a $40B market cap. If we assume they ramp FCF margins from 12% last year to 25% in the coming years, and that revenue growth compounds at 25% annually for the foreseeable future (which would put them in the hall-of-fame of revenue growth), it would take 15 years to earn your investment back in free cash flow.
Now consider that Snowflake’s peak market cap was over $120B. So investors who bought shares when they were trading above $350 (which happened multiple times) were not expecting to be paid back by the cash generated for well over 20 years. More likely, they were simply speculating rather than investing. At the highs last fall, the market was riddled with examples like this.
Another exercise I found useful is to look at the historical data discussed above and calculate the free cash flow payback period on a rolling basis.
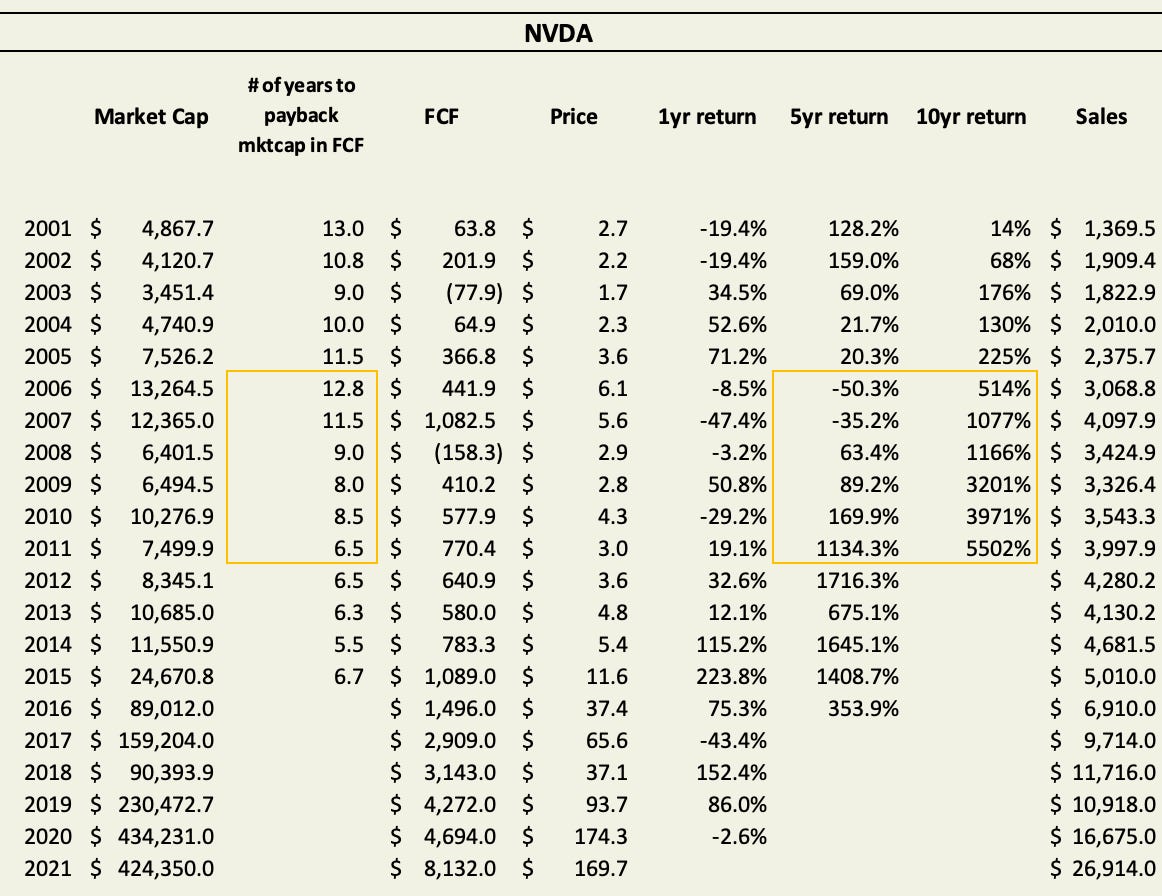
Now we have the benefit of hindsight and can see not only how long it would take a company to payback their market cap at a given time, but what happens to the share price over that same time period.
If you bought Nvidia shares in 2006, the company would not go on to earn its then $13B market cap for almost 13 years. By 2011, the market cap had cratered to $7.5B and FCF improved. NVDA would earn that market cap in FCF in just 6.5 years.
As the number of years needed to pay back the market cap in free cash flow shortened from 12.8 to 6.5, the forward return skyrocketed. If you bought in 2006, you would have lost 50% over the next five years and been up 514% over the next 10 years. If you bought in 2011, you would have been up 1,134% in the following five years and 5,502% in ten.
In other words, the less time it takes a company to earn its market cap in free cash flow, the more the share price should increase over that time. If this seems obvious and intuitive, that’s good. This is an exercise in internalizing a truth that is easily forgotten.
Domino’s Pizza tells a similar story with two inflection points. As the payback period dropped from 12.5 years to 4.5 years, the forward 10-year return went from 397% to 3,457%. Then, as the payback period grew back to over 8 years, the forward return shrunk to 1,186%.
A DPZ investment in 2008 would require quite the contrarian view. Looking backwards it seems obvious, but the stock had been cut by two thirds, and free cash flow was essentially flat over a seven-year period. As is the case with many of the examples I looked at, the highest forward return numbers came after periods of ugly share performance and free cash flow declines.
Monster Beverage Corporation, similar to Domino’s, has two inflection points but in reverse order, with the payback period lengthening, then contracting.
The bottom line is that the number of years that it takes a company to pay back its market cap in free cash flow is, historically, inversely correlated with share price gains. The shorter the period, the higher the forward return.
If you think Company A can realistically generate its market cap in cash over the next seven years, and Company B can do it in nine, provided that you plan on a long holding period, you should buy Company A. This (purposefully) leaves out any noise about what multiple investors may be willing to assign Company A or B in the future.
The bottom bottom line is that the growth of a company’s free cash flow and its share price are inextricably tied. This has been my attempt to convince myself that this is indeed the case using historical examples, and I hope it makes others less likely to lose sight of that important truth.


May I know how you calculate # of years to payback mktcap in FCF?